First prediction
After finishing this section, you will have seven prediction charts (one per granularity), and you will be able to point at the chart and say: which part is history, which is the actual movement, and which is drawn by the model.
1. Run the default seven examples
In the KiT directory, under the kit environment:
python eval/infer_for_pred.pyWithout arguments, the script runs seven prewritten examples, one per granularity. Our full run took 57 seconds.
You should see something like this (only the 1-hour entry is shown here):
[info] loaded EMA weights (step=50000)
device=cuda precision=bf16 K=16 steps=32 solver=euler cfg_w=1.0 hist_cfg_w=1.0 ckpt=step_market_284M.pt
[5/7] 300733.SZ 1h history 2025-09-11 10:30:00 .. 2026-02-09 15:00:00 (400 bars)  predicted 2026-02-10 10:30:00 .. 2026-02-24 15:00:00 (20 bars)
      terminal return actual +4.95%  predicted median +3.37% [q05 +1.04%, q95 +6.64%]  cumulative-return curve corr 0.902  3.7s
...
Plots saved to results/infer_for_pred
step=50000 is a legacy field left in the checkpoint; the official model card states the weights themselves are unchanged, so you can ignore it.
2. Read that line of numbers
Look it upThe … in this line
Click one to see.
3. Read that chart
The charts are in results/infer_for_pred/, with filenames like 代码_粒度_日期.png:
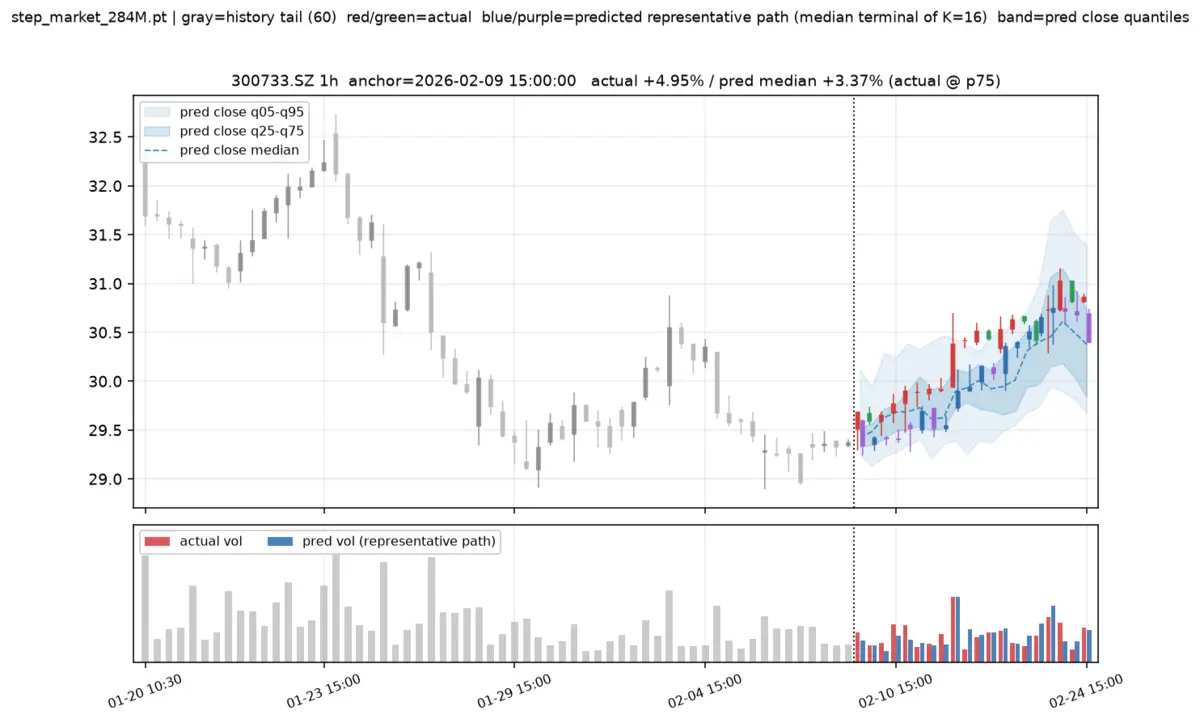
- Gray K-lines: history before the anchor (only the last 60 bars are drawn)
- Vertical dashed line: the anchor
- Red/green K-lines: what actually happened after the anchor
- Blue-purple K-lines: one "representative path", chosen as the one whose endpoint gain/loss ranks in the middle among 16 paths
- Two blue bands, dark and light: the 16 paths' closing prices' 25%~75% and 5%~95% ranges; the dashed line is the median
- Bars at the bottom: volume; red is real, blue is from the representative path
When reading the chart, focus on the bands rather than the single blue-purple K-line. A wide band means the model itself is uncertain about this period.
4. Predict a time point of your own choosing
One example is written as 代码,粒度,锚点:
python eval/infer_for_pred.py --case 300368.SZ,1d,2026-01-05 --case 300733.SZ,1h,"2026-02-09 15:00"The example in the README won't run on the demo data
The README's 601899.SH and 300750.SZ are not among the 100 demo-only stocks, and you will get:
300750.SZ is not in .../data/instruments.json (must be one of the 100 stocks with local data)To see which codes are available, check data/instruments.json.
5. Why the two results differ
For the same example 300368.SZ,1d,2026-01-05, when we ran it standalone, the endpoint median was −27.28%; when run as the seventh of the default seven examples, it was −21.31%.
The reason is the random seed: in the script, the i-th example uses a seed of --seed plus i. Different seeds mean different initial blobs of 16 noise, so the drawn paths differ.
So don't draw conclusions from a single number from one prediction. Look at the interval, or increase the number of paths (covered in the next section). To make results fully reproducible, fix --seed and keep the order of the examples unchanged.
Quiz timeThe blue band on the prediction chart is wide — what does that mean?
Check yourself
- There are 7 png files and 7 npz files in
results/infer_for_pred/ - I can point out the anchor, the actual movement, and the prediction bands on the chart
- I used
--caseto predict a stock and date of my own choosing
Next section: Anchor and window.